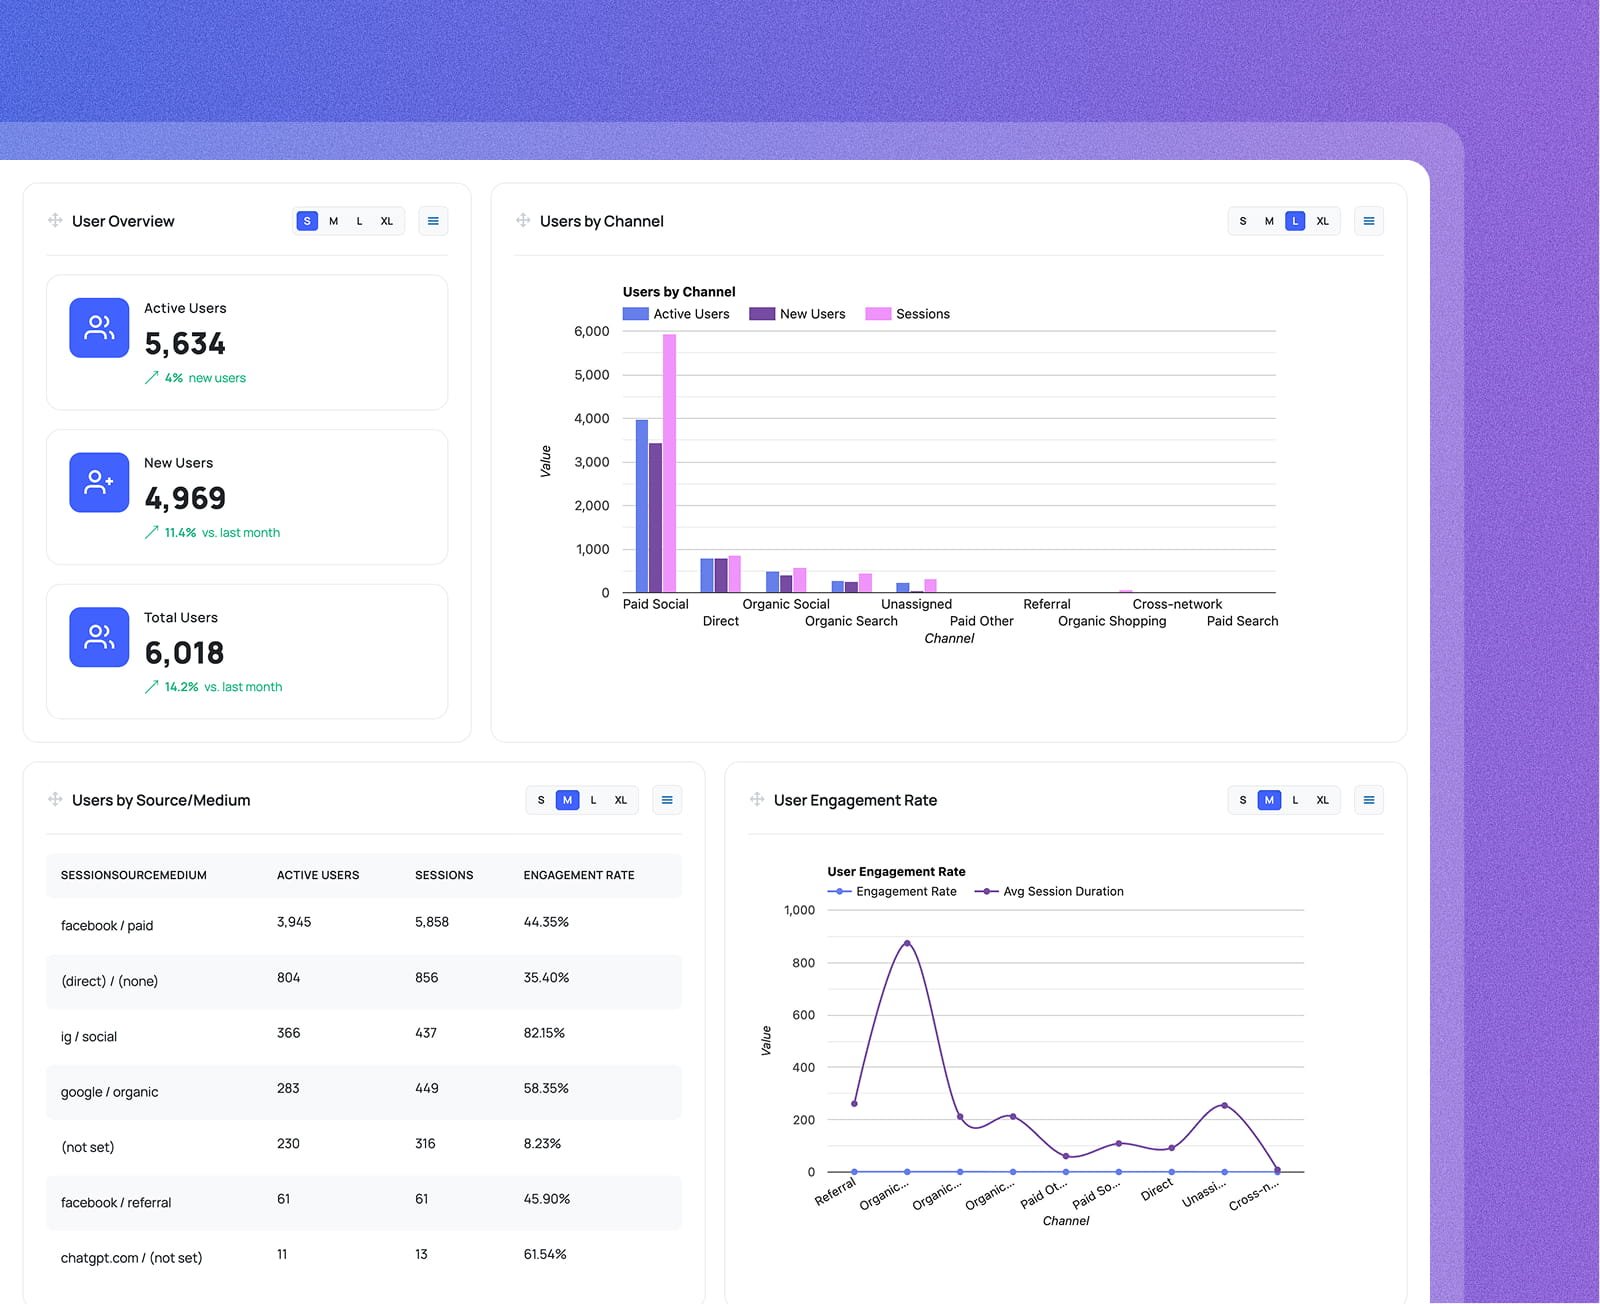
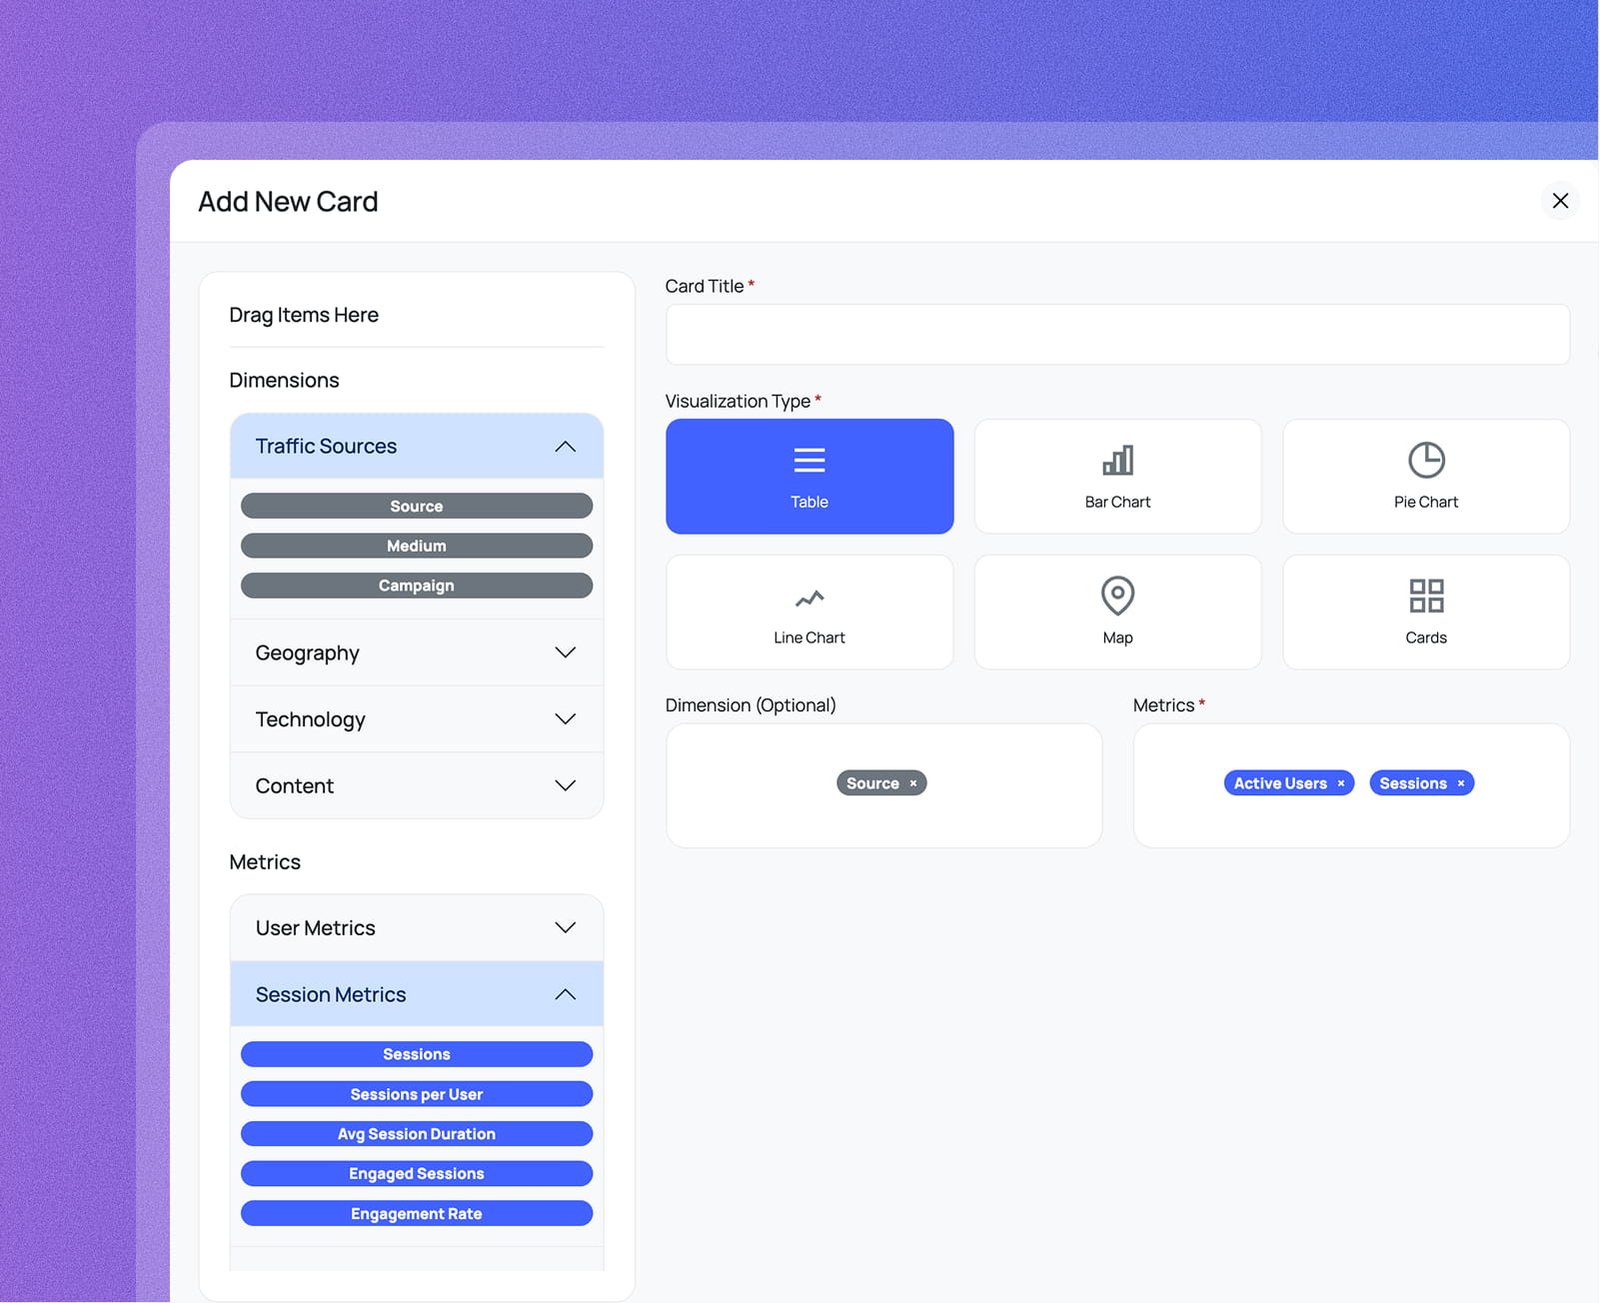
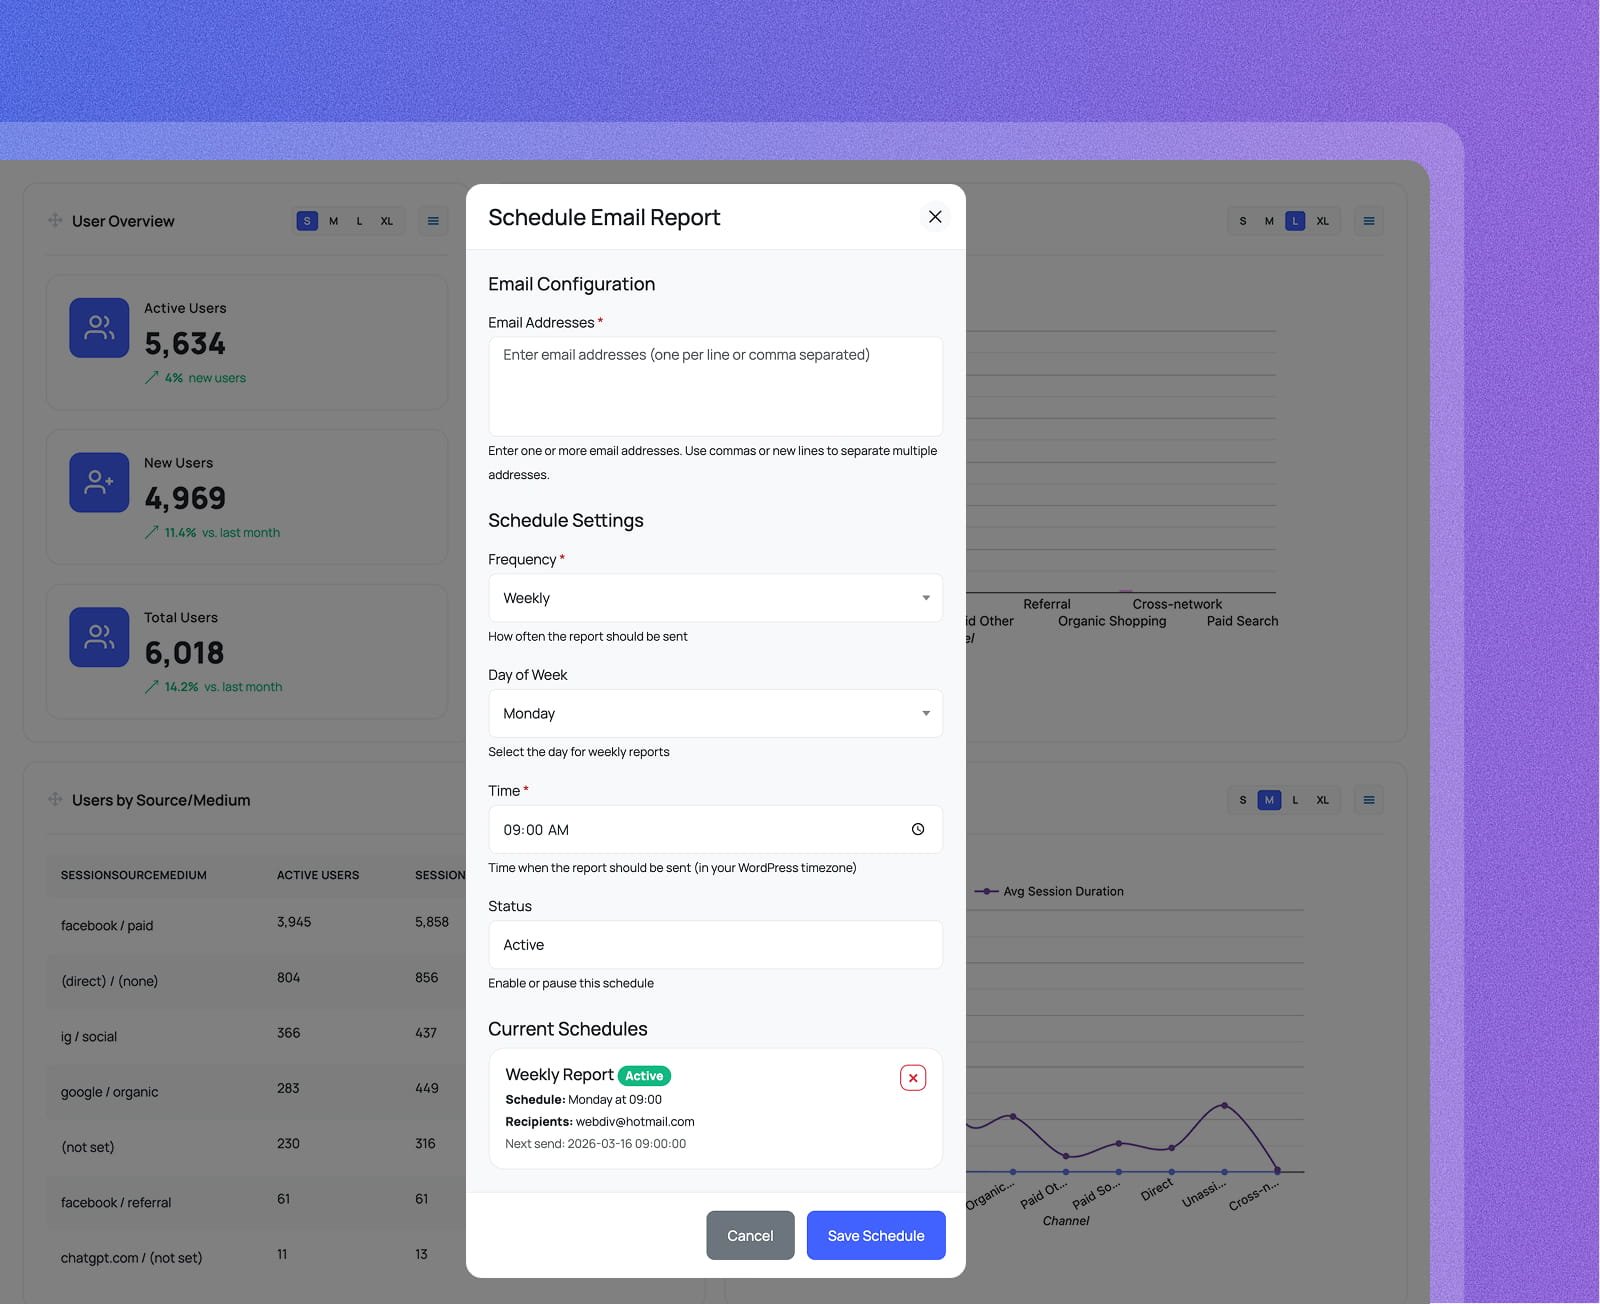
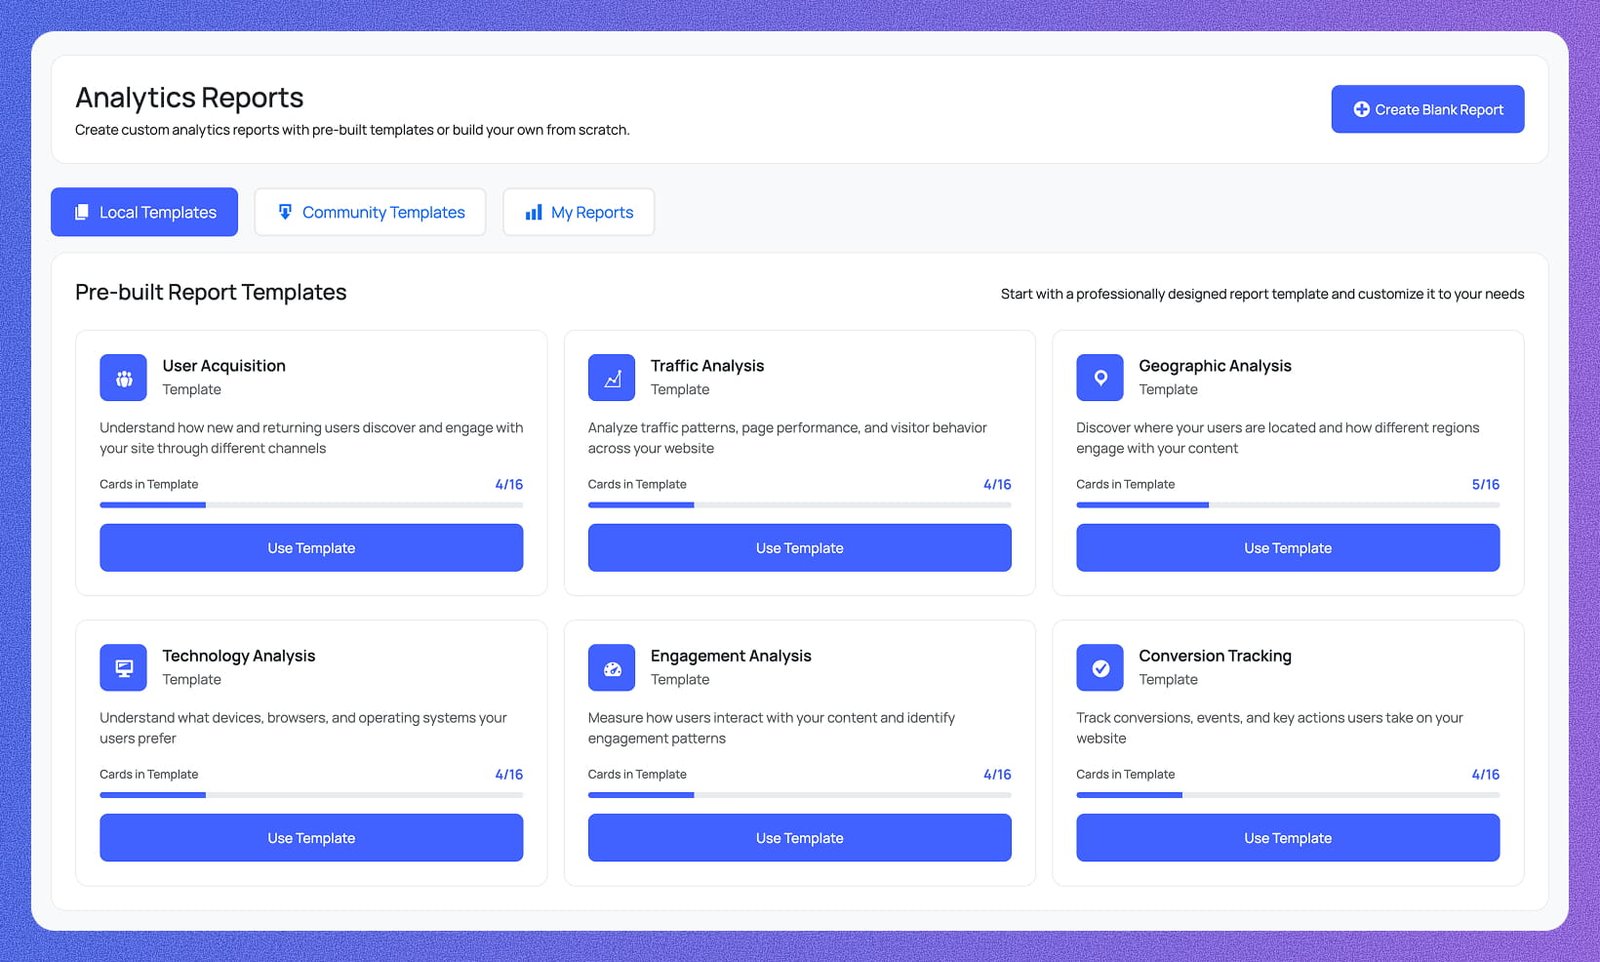
GA4 Analytics Reports

Powerful Reports,
Built Into WordPress

Access pre-built GA4 reports for traffic, user acquisition, engagement, and more — all inside wp-admin without switching tabs.

Analytics Reports inside WordPress
Live GA4 Data
Traffic & Engagement Reports

Everything You Need to
Build Powerful GA4 Reports

Pre-built templates, a custom report builder, drag-and-drop cards,
and community reports — all inside your WordPress dashboard.

Pre-built Report Templates

Start instantly with professionally designed templates — User Acquisition, Traffic Analysis, Geographic Analysis, Engagement, Technology, and more.

Local, Community & My Reports

Browse community-submitted reports, access your saved custom reports, or start from a local template — all organized in one tabbed interface.

Drag & Drop Card Builder

Add any card to your report by dragging dimensions and metrics into the builder. Choose Table, Bar Chart, Pie Chart, Line Chart, Map, or Cards visualization.

Rich Dimensions & Metrics

Pick from Traffic Sources, Geography, Technology, and Content dimensions. Combine with User Metrics, Session Metrics, and more to build any report you need.

User Acquisition Reports

Track Active Users, New Users, and Total Users with trend indicators. Break down acquisition by channel — paid, organic, direct, social, and referral — all in one report.

Schedule Email & Share Reports

Schedule any report as an email delivery, edit it anytime, or submit it to the community so other Analytix users can discover and use your template.

Powerful GA4 Reports,
Built Into WordPress

From user acquisition to custom card builders and scheduled emails —
every report you need, right inside your WordPress dashboard.

Track every user from first visit to conversion

See Active Users, New Users, and Total Users at a glance with trend indicators. Drill into channel breakdowns — paid, organic, direct, social, and referral — to know exactly where growth is coming from.

Active, New & Total Users
Monitor all three user metrics side by side with percentage change indicators so you can spot growth trends instantly.
Users by Channel
A grouped bar chart breaks down Active Users, New Users, and Sessions by channel — paid, organic, direct, social, and referral.
Source / Medium Table
A detailed table ranks every source/medium by user volume so you know which campaigns and referrers are delivering the most growth.
Track every user from first visit to conversion screenshot
Active, New & Total Users
Monitor all three user metrics side by side with percentage change indicators so you can spot growth trends instantly.
Users by Channel
A grouped bar chart breaks down Active Users, New Users, and Sessions by channel — paid, organic, direct, social, and referral.
Source / Medium Table
A detailed table ranks every source/medium by user volume so you know which campaigns and referrers are delivering the most growth.

Build any report with a drag-and-drop card builder

Add any visualization to your custom report in seconds. Pick your dimensions and metrics, choose a chart type, and arrange cards exactly how you want them.

Add Cards Instantly
Click "Add New Card" and choose from Table, Bar Chart, Pie Chart, Line Chart, Map, or Summary Cards to add to your report.
Pick Dimensions & Metrics
Select from Traffic Sources, Geography, Technology, and Content dimensions, then combine with any user, session, or engagement metric.
Arrange & Save Your Layout
Drag cards into any order, save your custom report, and share it with your team or submit it to the community library.
Build any report with a drag-and-drop card builder screenshot
Add Cards Instantly
Click "Add New Card" and choose from Table, Bar Chart, Pie Chart, Line Chart, Map, or Summary Cards to add to your report.
Pick Dimensions & Metrics
Select from Traffic Sources, Geography, Technology, and Content dimensions, then combine with any user, session, or engagement metric.
Arrange & Save Your Layout
Drag cards into any order, save your custom report, and share it with your team or submit it to the community library.

Deliver reports automatically with scheduled email delivery

Set up automated report emails on your own schedule. Choose daily, weekly, or monthly delivery, pick the recipients, and let Analytix do the rest.

Flexible Schedule Options
Send reports on any cadence — daily, weekly, or monthly — with a configurable send time so reports land when your team needs them.
Multiple Recipients
Add as many email recipients as you need. Keep stakeholders, clients, and team members automatically up to date without manual exports.
Edit or Cancel Anytime
Update the report, change the schedule, swap recipients, or cancel delivery at any time directly from the WordPress dashboard.
Deliver reports automatically with scheduled email delivery screenshot
Flexible Schedule Options
Send reports on any cadence — daily, weekly, or monthly — with a configurable send time so reports land when your team needs them.
Multiple Recipients
Add as many email recipients as you need. Keep stakeholders, clients, and team members automatically up to date without manual exports.
Edit or Cancel Anytime
Update the report, change the schedule, swap recipients, or cancel delivery at any time directly from the WordPress dashboard.
FAQ

Frequently Asked Questions

Everything you need to know about Analytix and Google Analytics 4 for WordPress.

Analytix is a WordPress plugin that connects directly to Google Analytics 4 (GA4) and surfaces your data inside wp-admin — no tab-switching, no GA4 login required. Authenticate once with your Google account, select your GA4 property, and your full dashboard appears instantly: sessions, users, real-time visitors, top pages, traffic sources, device breakdowns, geographic stats, and more. A built-in setup wizard walks you through every step.

Yes — Analytix reads data from your existing GA4 property via the Google Analytics Data API. If you don't have one yet, create a free account at analytics.google.com, add your website as a property, and then connect it to Analytix in under two minutes. The plugin also handles GA4 tracking code insertion automatically, so you won't need to edit any theme files.

The dashboard gives you a full GA4 overview in one place: sessions, active users, new vs. returning users, event count, engaged sessions, bounce rate, average session duration, and screen pageviews. Below that you get sessions by device, top countries and cities, top browsers and operating systems, top pages and landing pages, and traffic channel breakdowns — all filterable by date range.

Yes. Analytix injects per-post stats directly into the WordPress post and page list screens, so authors and editors can instantly see how each piece of content is performing without leaving the editor. You control which post types and user roles get access — contributors and authors can view their own content stats while admins retain full dashboard access.

Absolutely. The WooCommerce E-commerce Analytics add-on gives you a dedicated store dashboard with revenue, total transactions, average order value, and conversion rate alongside a full product performance table. You also get real-time store activity — live visitors, items currently in cart, and today's orders — all visible inside wp-admin without touching the GA4 interface.

The Search Console add-on pulls your Google Search Console data directly into WordPress — search queries, top-ranking pages, impressions, clicks, CTR, and average position. You can track keyword movements and SEO traffic trends side-by-side with your GA4 metrics, giving you a complete picture of organic performance without switching between tools.

Yes. Analytix includes a built-in Event Builder to define and track custom GA4 events without code, a Conversion Tracking module to set and monitor conversion goals, and a Campaign Tracking module with a UTM URL builder so you can measure the exact performance of every marketing campaign you run.

Yes. The Email Notifications module lets you schedule recurring analytics reports — choose which sections to include, set the delivery day and time, and add as many recipients as you need. Your whole team stays informed with fresh data delivered to their inbox automatically, with no manual effort required.

No. Analytix only runs inside the WordPress admin area. It fetches data from the GA4 API server-side and caches the results, so front-end page speed is completely unaffected. Your visitors never load any Analytix scripts — the only front-end addition is the standard GA4 tracking snippet that you would add regardless.

Yes. Analytix is fully compatible with WordPress Multisite networks. Each site in the network can connect to its own GA4 property independently, and the plugin is translation-ready with full i18n support so it works in any language your team uses.

Measure, Understand and Grow Your Audience

Connect GA4 in under a minute. Start making data-driven decisions today.

Get Analytix Now!