E-commerce Analytics

Track Revenue & Sales,
Right Inside WordPress

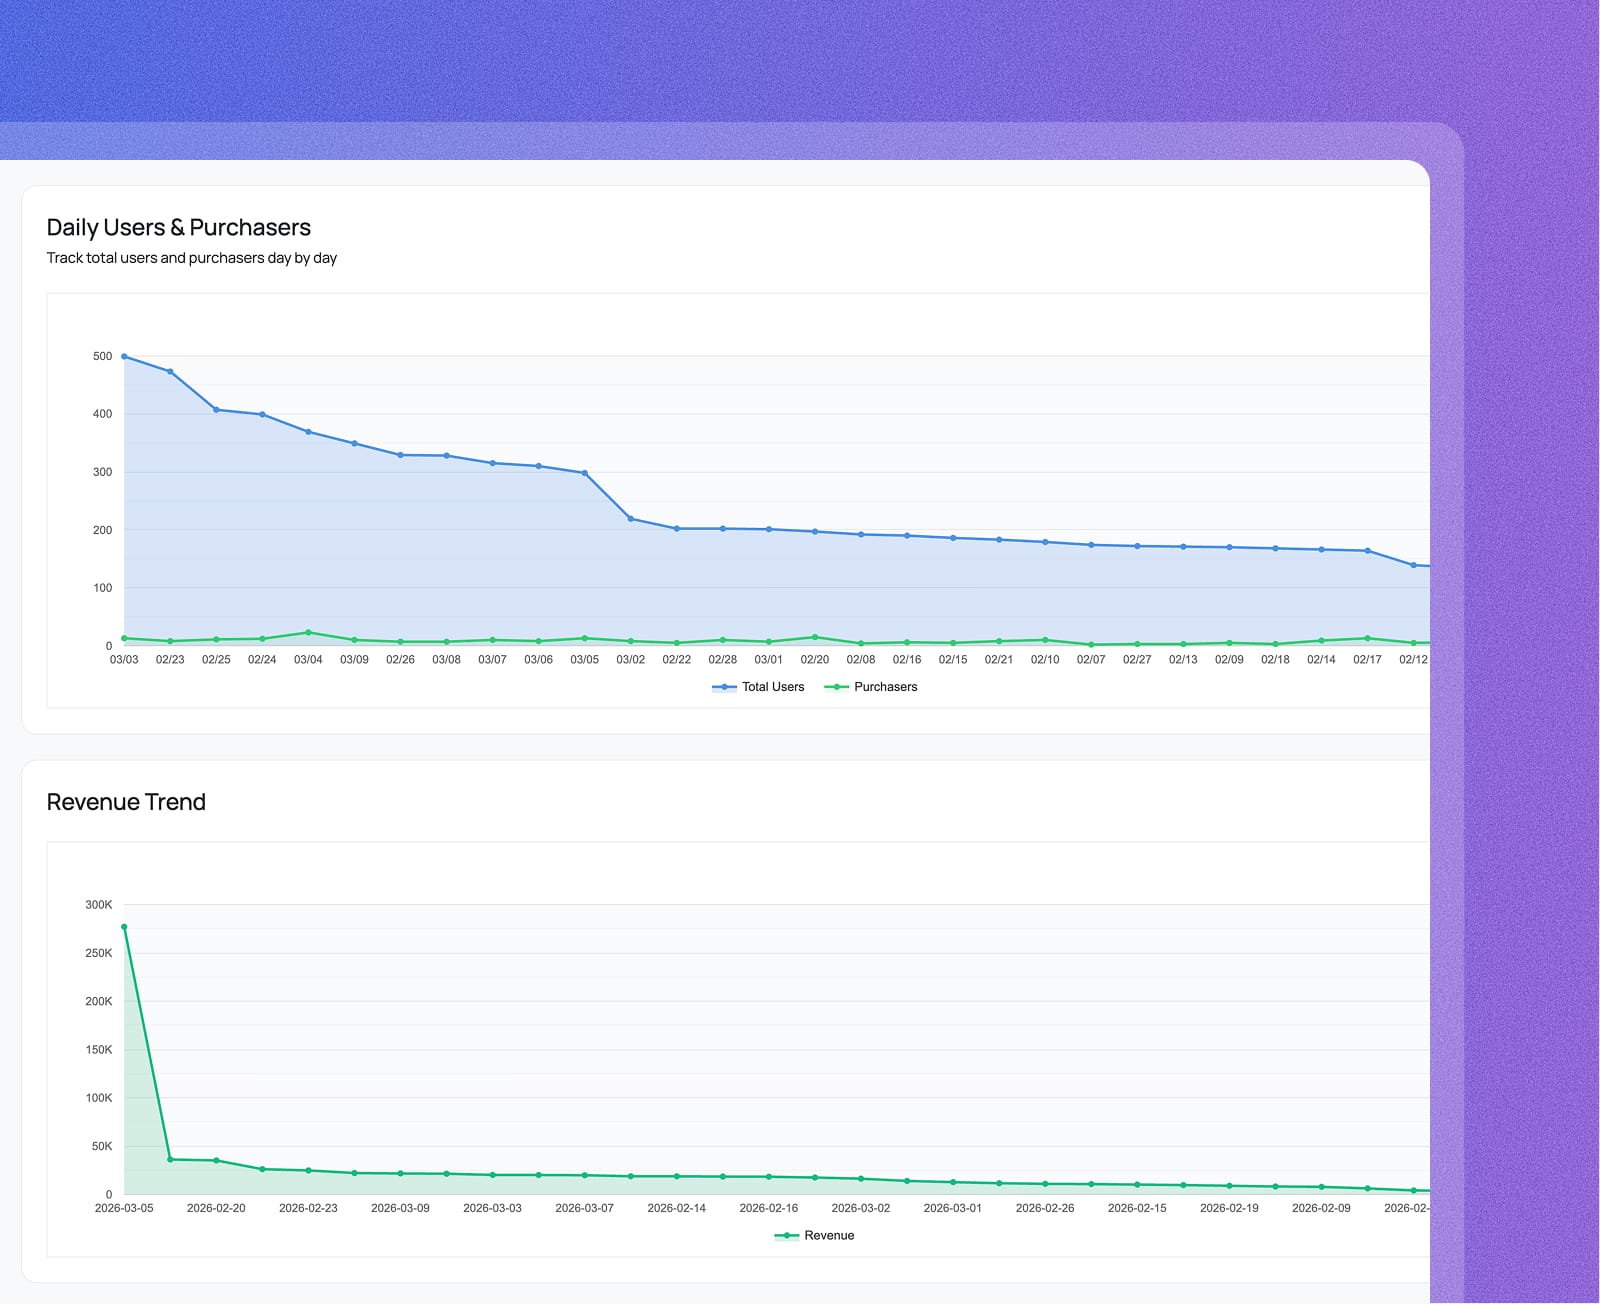
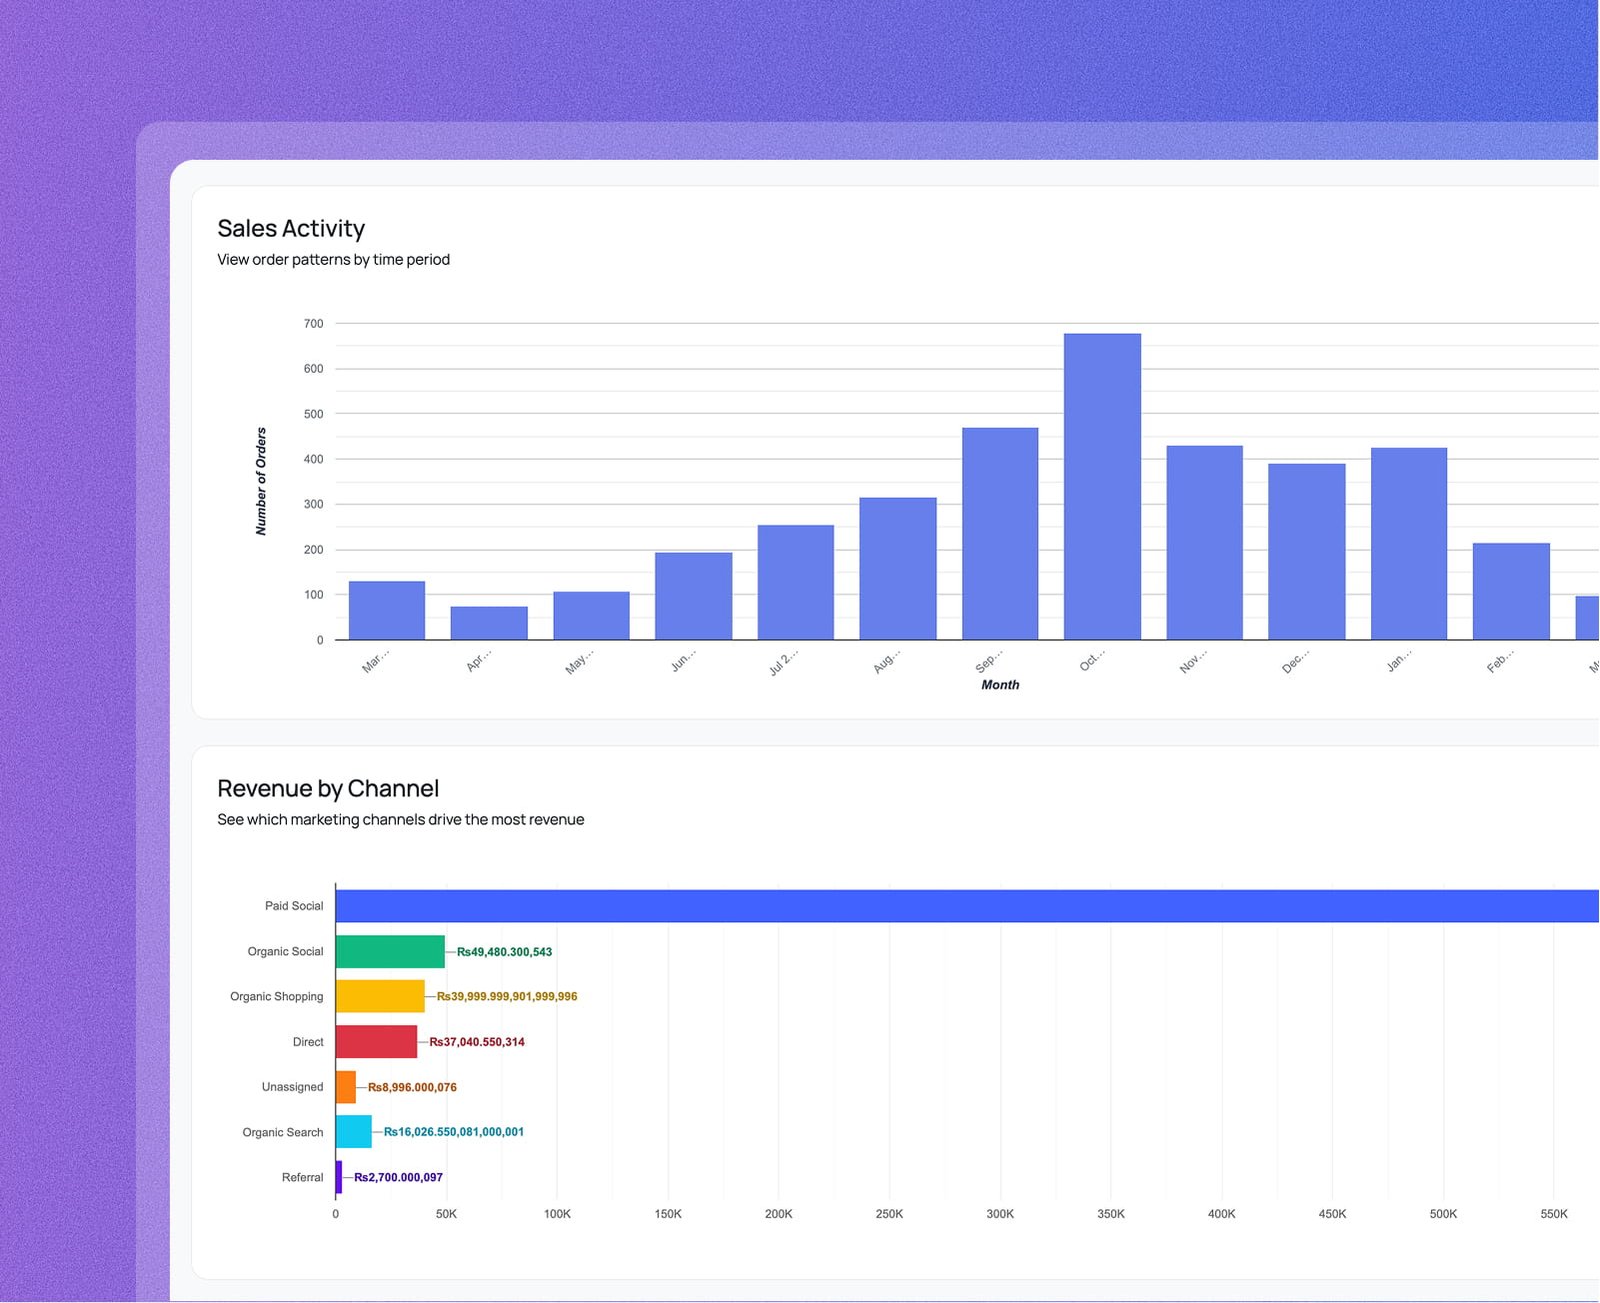
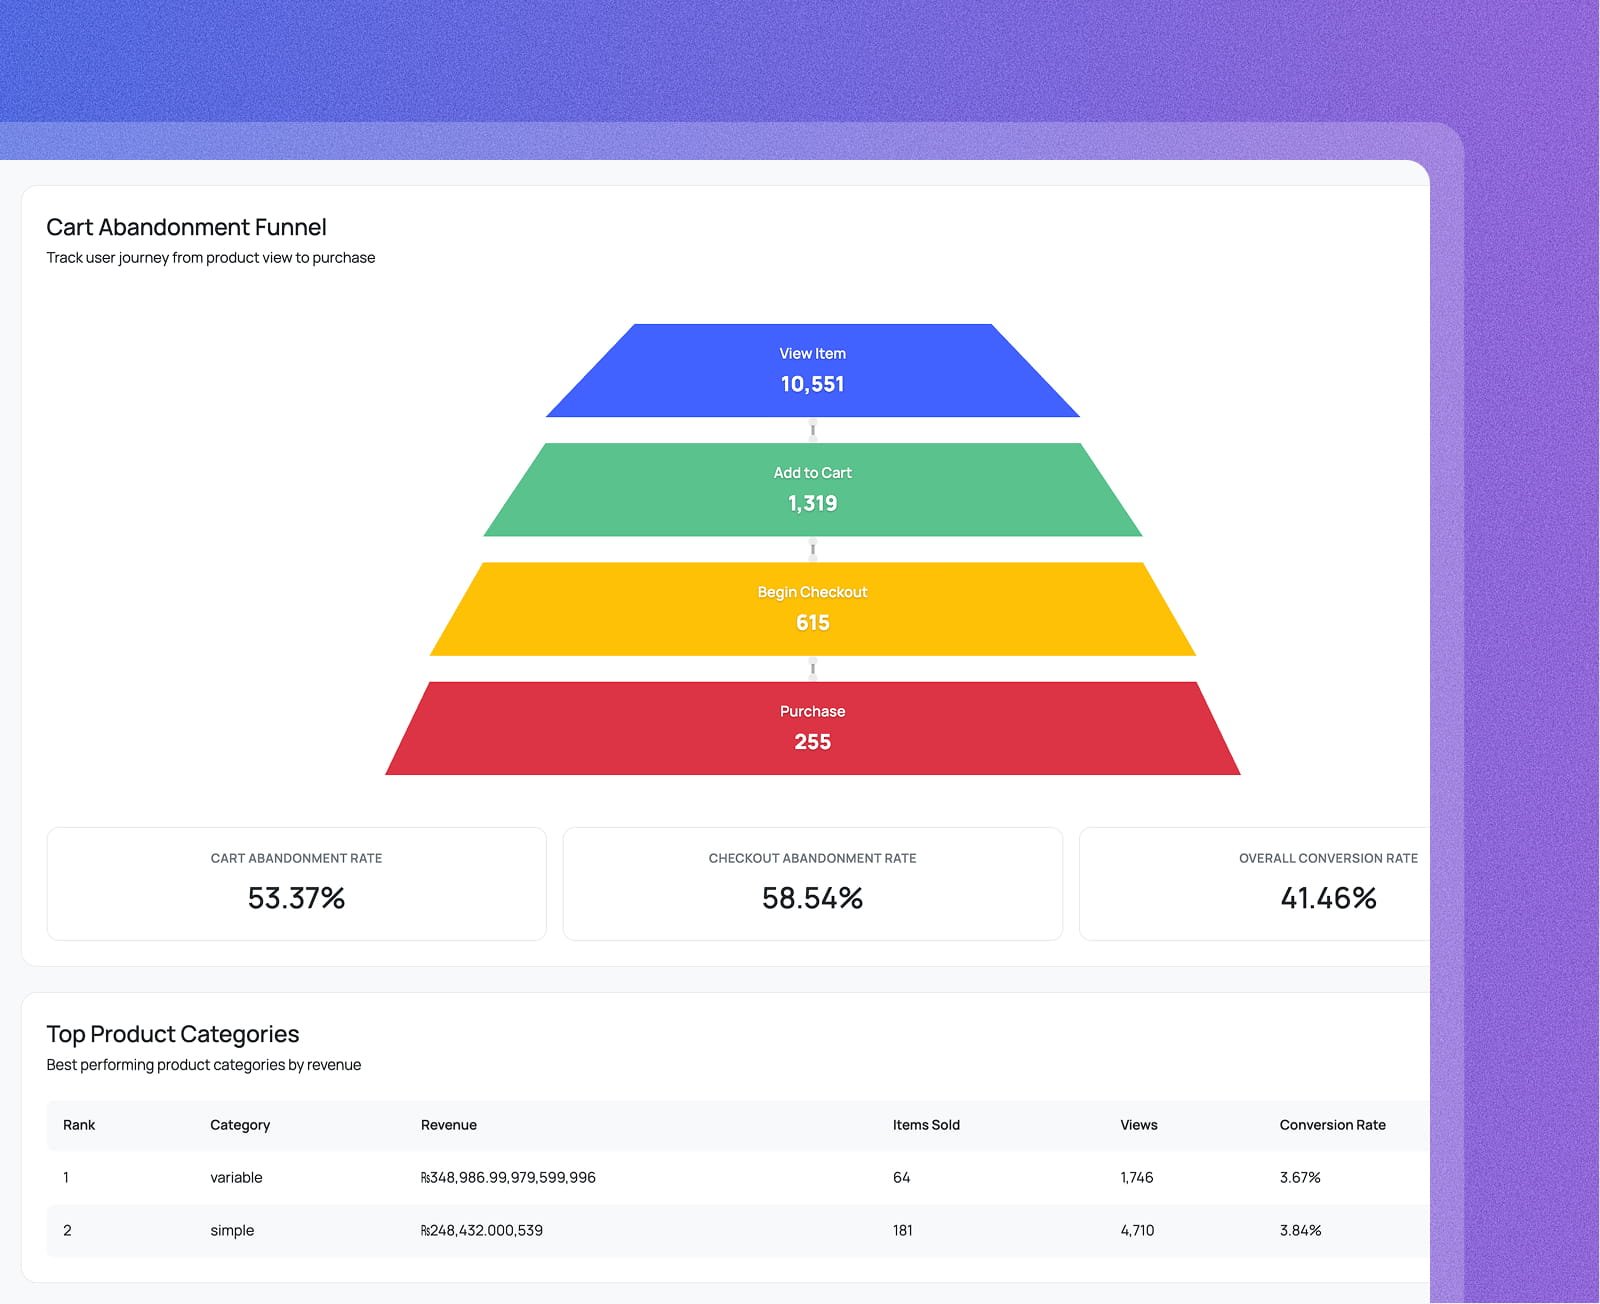
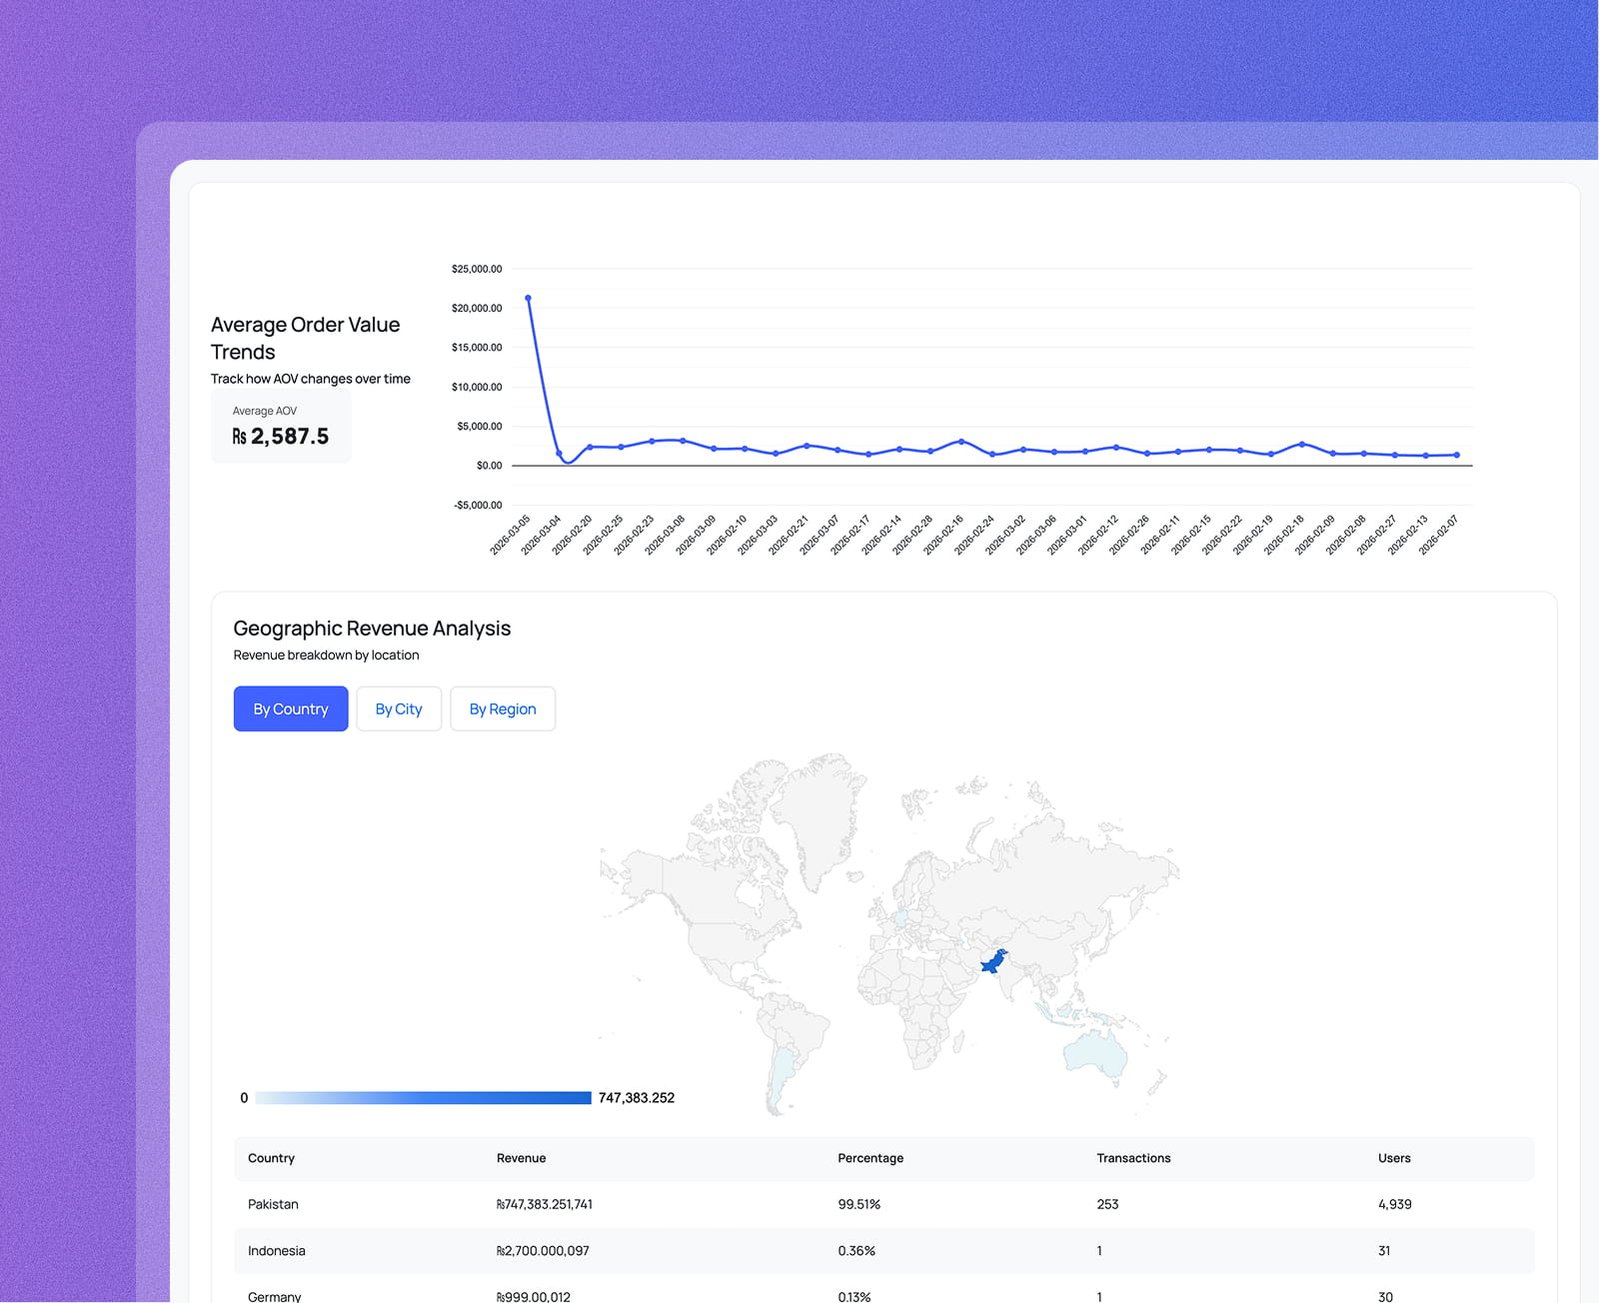
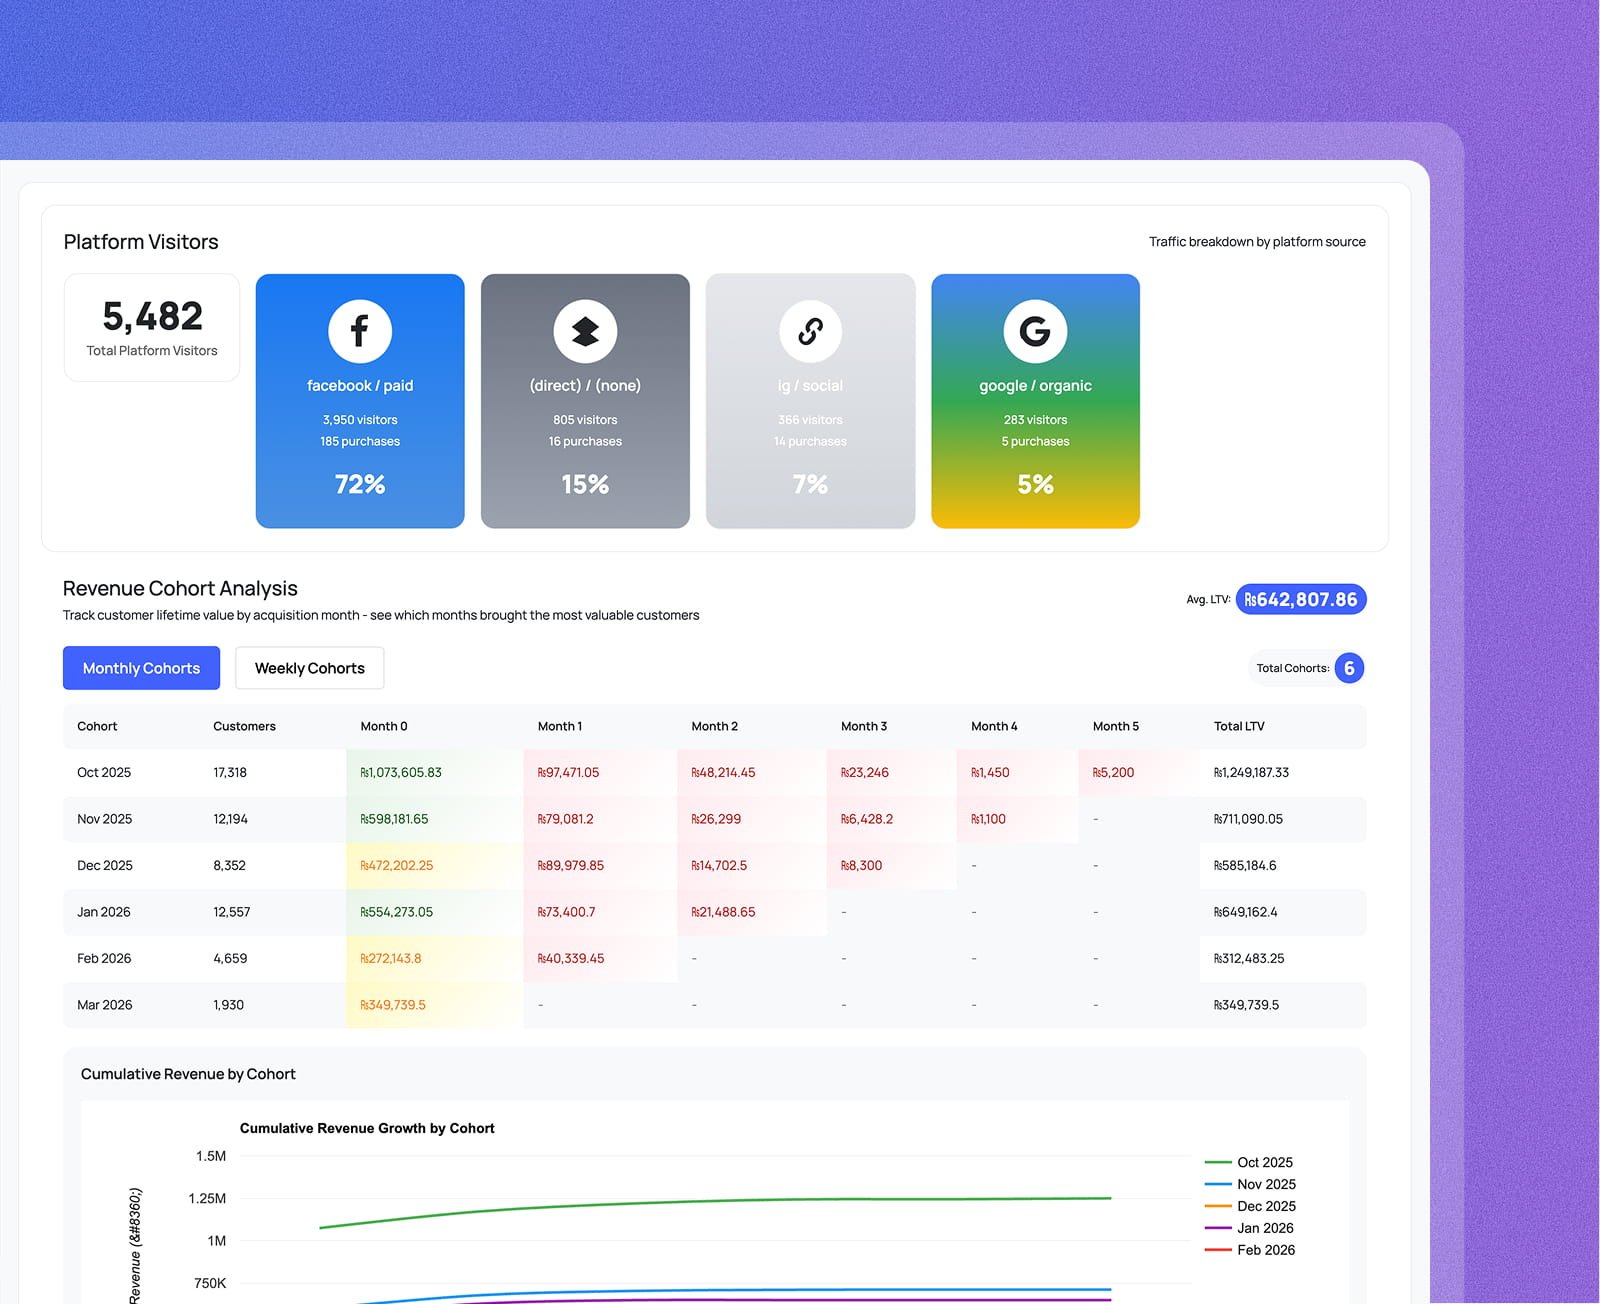
Connect your WooCommerce store to GA4 and monitor orders, revenue, conversion rates, and top products — all without leaving wp-admin.
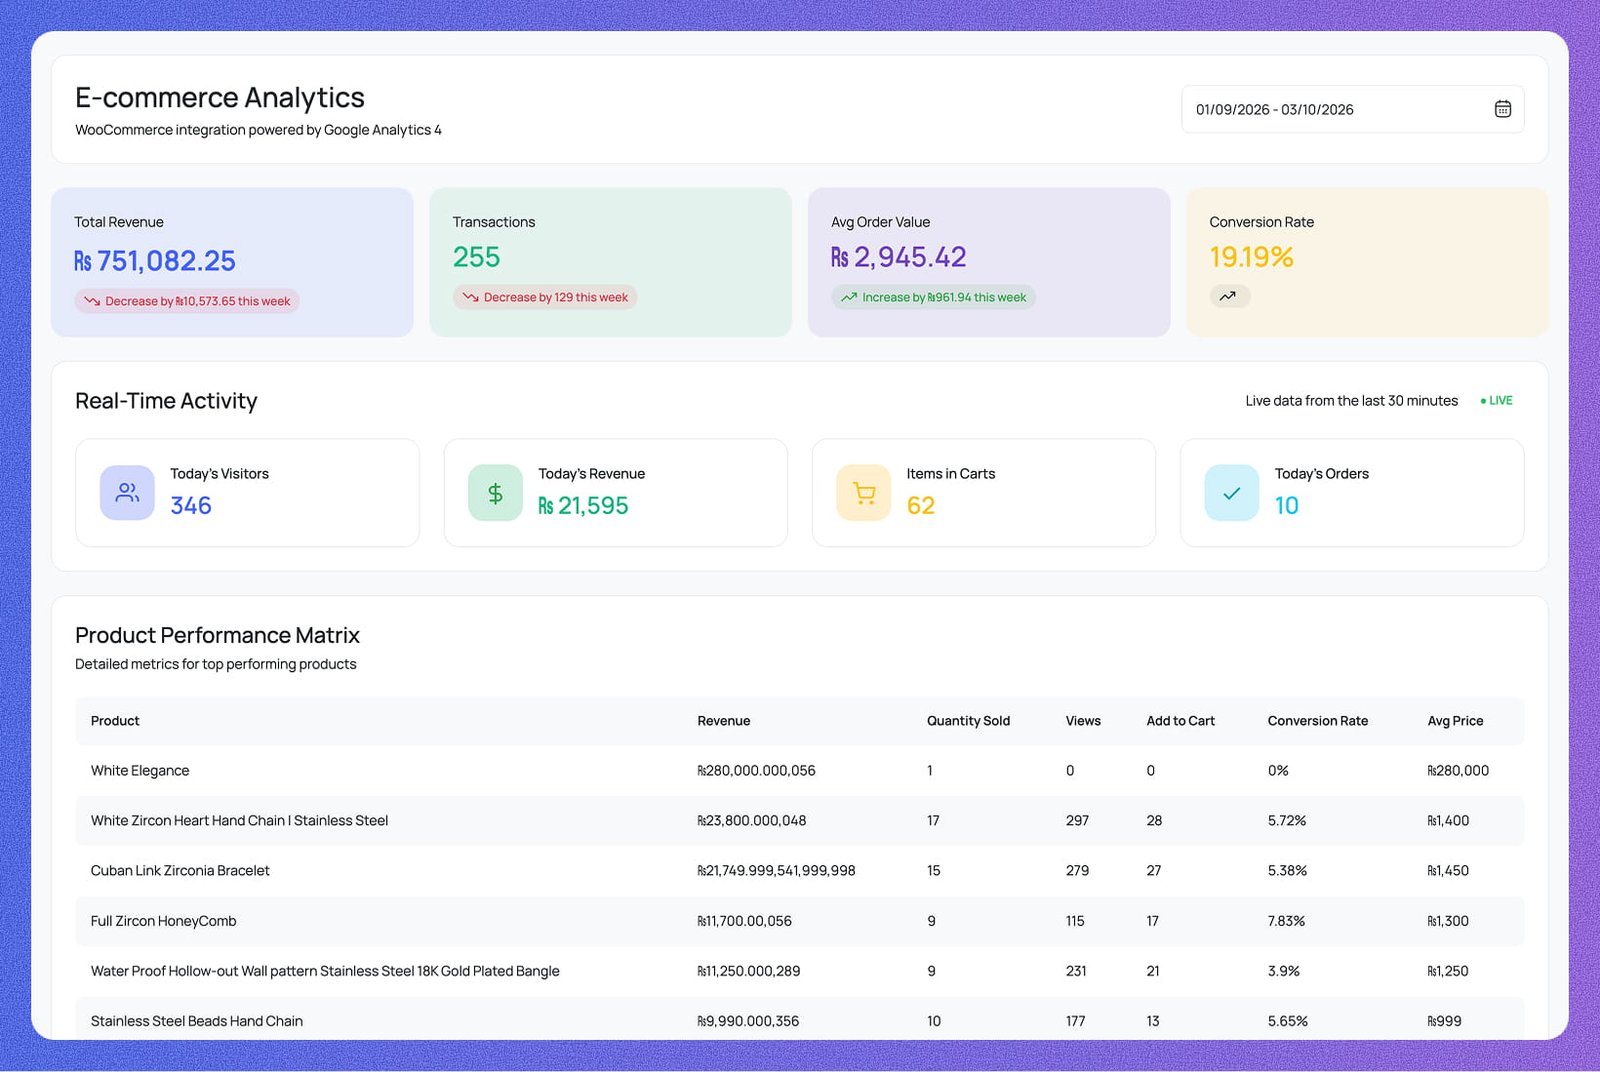
E-commerce Analytics inside WordPress
Live GA4 Data
Revenue & Order Insights

Everything You Need to
Track E-Commerce Performance

Revenue trends, sales activity, purchaser tracking, and channel attribution —
all surfaced right inside your WordPress dashboard.

Real-Time Activity

See live store data from the last 30 minutes — today's visitors, today's revenue, items in carts, and today's orders — all updating in real time alongside key metrics like total revenue, transactions, AOV, and conversion rate.

Product Performance Matrix

Compare every product across revenue, quantity sold, views, add-to-carts, conversion rate, and average price in a single detailed table. Instantly surface your top earners and identify products with high views but low conversions.

Daily Users & Purchasers

Track total users alongside purchasers on a dual-line area chart, day by day. The visual gap between the two lines shows exactly how many visitors are not converting — giving you a clear target to improve.

Revenue Trends & Cohort Analysis

Visualize daily revenue on a smooth area chart, then drill into cohort heatmaps that track customer lifetime value month by month from acquisition. The cumulative revenue curve shows which cohorts generate the most long-term value.

Sales Activity

View order volumes as a bar chart switchable between monthly, weekly, and daily views. Pinpoint your peak sales periods — like an October spike — and time your promotions and stock replenishment around them.

Revenue by Channel

See which marketing channels — paid social, organic social, organic shopping, direct, referral, and more — generate the most revenue in a color-coded horizontal bar chart. Know exactly where to double down your ad spend.

Cart Abandonment Funnel

Visualize the full purchase journey — View Item → Add to Cart → Begin Checkout → Purchase — as a trapezoid funnel. Surface cart abandonment rate, checkout abandonment rate, and overall conversion rate at a glance.

Top Categories & Customer Segmentation

Rank your product categories by revenue, items sold, views, and conversion rate. Then break your buyers into new vs. returning segments — each showing their own revenue, transactions, user count, and average order value with a pie chart split.

AOV, Geographic & Platform Insights

Track average order value over time on a line chart, see which countries and regions drive revenue on an interactive world map, and compare platform visitors and purchases across Facebook, Google, Instagram, and direct sources.

Every E-Commerce Metric,
Visualized in One Place

From daily buyer trends to cart abandonment and platform attribution —
everything your store needs to grow, right inside WordPress.

Track the daily gap between visitors and buyers

A dual-line area chart overlays total users and purchasers day by day. The space between the two lines is your conversion opportunity — shrink it with smarter offers and checkout improvements.

Total Users vs. Purchasers
Both metrics are plotted on the same chart — blue for total users, green for purchasers — so the conversion gap is impossible to miss.
Day-by-Day Breakdown
Hover any date to see exact user and purchaser counts for that day. Spot weekday vs. weekend patterns and align your campaigns accordingly.
Conversion Trend at a Glance
Watch how your purchase rate shifts after a promotion, price change, or checkout update — the chart reflects the impact in real time.
Track the daily gap between visitors and buyers screenshot
Total Users vs. Purchasers
Both metrics are plotted on the same chart — blue for total users, green for purchasers — so the conversion gap is impossible to miss.
Day-by-Day Breakdown
Hover any date to see exact user and purchaser counts for that day. Spot weekday vs. weekend patterns and align your campaigns accordingly.
Conversion Trend at a Glance
Watch how your purchase rate shifts after a promotion, price change, or checkout update — the chart reflects the impact in real time.

See your order volume by any time period

A bar chart of order counts, switchable between monthly, weekly, and daily views. Identify your highest-volume periods and plan inventory and ad budgets around your real sales rhythm.

Monthly, Weekly & Daily Views
Switch the time granularity with a single click to zoom in on a specific week or zoom out for a full-year seasonal overview.
Peak Period Detection
Instantly spot high-volume months like October or November so you can prepare stock, staffing, and promotions well in advance.
Tooltip Order Detail
Hover any bar to see the exact month and order count — no guessing, just clean numbers for every period in your selected range.
See your order volume by any time period screenshot
Monthly, Weekly & Daily Views
Switch the time granularity with a single click to zoom in on a specific week or zoom out for a full-year seasonal overview.
Peak Period Detection
Instantly spot high-volume months like October or November so you can prepare stock, staffing, and promotions well in advance.
Tooltip Order Detail
Hover any bar to see the exact month and order count — no guessing, just clean numbers for every period in your selected range.

Find exactly where shoppers drop out of your funnel

A four-step trapezoid funnel — View Item, Add to Cart, Begin Checkout, Purchase — shows the exact volume at every stage alongside cart abandonment rate, checkout abandonment rate, and overall conversion rate.

4-Stage Purchase Funnel
Each stage is sized proportionally so you can instantly see where the biggest drop-offs happen — from 10,551 views down to 255 purchases.
Cart & Checkout Abandonment Rates
GA4-powered rates show what percentage of shoppers abandon their cart and what percentage abandon at checkout — two very different problems with different fixes.
Overall Conversion Rate
A single bottom-line metric tells you what share of product viewers actually complete a purchase — your core e-commerce health indicator.
Find exactly where shoppers drop out of your funnel screenshot
4-Stage Purchase Funnel
Each stage is sized proportionally so you can instantly see where the biggest drop-offs happen — from 10,551 views down to 255 purchases.
Cart & Checkout Abandonment Rates
GA4-powered rates show what percentage of shoppers abandon their cart and what percentage abandon at checkout — two very different problems with different fixes.
Overall Conversion Rate
A single bottom-line metric tells you what share of product viewers actually complete a purchase — your core e-commerce health indicator.

See which platforms send the most buyers

A platform breakdown shows total visitors and purchase share for each traffic source — Facebook paid, Google organic, Instagram, direct, and more — so you know exactly where your paying customers come from.

Per-Platform Visitor & Purchase Count
Each platform card shows visitor count and purchase count side by side — Facebook/paid drove 3,950 visitors and 185 purchases in the screenshot, for example.
Purchase Share Percentage
A bold percentage on each card tells you the share of total purchases that platform owns — instantly see if Facebook at 72% is worth your ad spend.
Total Platform Visitors Summary
A combined visitor count across all platforms sits alongside the breakdown so you always have the full picture alongside the per-channel split.
See which platforms send the most buyers screenshot
Per-Platform Visitor & Purchase Count
Each platform card shows visitor count and purchase count side by side — Facebook/paid drove 3,950 visitors and 185 purchases in the screenshot, for example.
Purchase Share Percentage
A bold percentage on each card tells you the share of total purchases that platform owns — instantly see if Facebook at 72% is worth your ad spend.
Total Platform Visitors Summary
A combined visitor count across all platforms sits alongside the breakdown so you always have the full picture alongside the per-channel split.
FAQ

Frequently Asked Questions

Everything you need to know about Analytix and Google Analytics 4 for WordPress.

Analytix is a WordPress plugin that connects directly to Google Analytics 4 (GA4) and surfaces your data inside wp-admin — no tab-switching, no GA4 login required. Authenticate once with your Google account, select your GA4 property, and your full dashboard appears instantly: sessions, users, real-time visitors, top pages, traffic sources, device breakdowns, geographic stats, and more. A built-in setup wizard walks you through every step.

Yes — Analytix reads data from your existing GA4 property via the Google Analytics Data API. If you don't have one yet, create a free account at analytics.google.com, add your website as a property, and then connect it to Analytix in under two minutes. The plugin also handles GA4 tracking code insertion automatically, so you won't need to edit any theme files.

The dashboard gives you a full GA4 overview in one place: sessions, active users, new vs. returning users, event count, engaged sessions, bounce rate, average session duration, and screen pageviews. Below that you get sessions by device, top countries and cities, top browsers and operating systems, top pages and landing pages, and traffic channel breakdowns — all filterable by date range.

Yes. Analytix injects per-post stats directly into the WordPress post and page list screens, so authors and editors can instantly see how each piece of content is performing without leaving the editor. You control which post types and user roles get access — contributors and authors can view their own content stats while admins retain full dashboard access.

Absolutely. The WooCommerce E-commerce Analytics add-on gives you a dedicated store dashboard with revenue, total transactions, average order value, and conversion rate alongside a full product performance table. You also get real-time store activity — live visitors, items currently in cart, and today's orders — all visible inside wp-admin without touching the GA4 interface.

The Search Console add-on pulls your Google Search Console data directly into WordPress — search queries, top-ranking pages, impressions, clicks, CTR, and average position. You can track keyword movements and SEO traffic trends side-by-side with your GA4 metrics, giving you a complete picture of organic performance without switching between tools.

Yes. Analytix includes a built-in Event Builder to define and track custom GA4 events without code, a Conversion Tracking module to set and monitor conversion goals, and a Campaign Tracking module with a UTM URL builder so you can measure the exact performance of every marketing campaign you run.

Yes. The Email Notifications module lets you schedule recurring analytics reports — choose which sections to include, set the delivery day and time, and add as many recipients as you need. Your whole team stays informed with fresh data delivered to their inbox automatically, with no manual effort required.

No. Analytix only runs inside the WordPress admin area. It fetches data from the GA4 API server-side and caches the results, so front-end page speed is completely unaffected. Your visitors never load any Analytix scripts — the only front-end addition is the standard GA4 tracking snippet that you would add regardless.

Yes. Analytix is fully compatible with WordPress Multisite networks. Each site in the network can connect to its own GA4 property independently, and the plugin is translation-ready with full i18n support so it works in any language your team uses.

Measure, Understand and Grow Your Audience

Connect GA4 in under a minute. Start making data-driven decisions today.

Get Analytix Now!